The Intelligence Layer Proposal New!

How We Can Build 80% of Every Project Now, and Thoughts on 4 Random Verticals

The Big Idea: 80% Overlap = 4x Market Leverage

The Core Insight

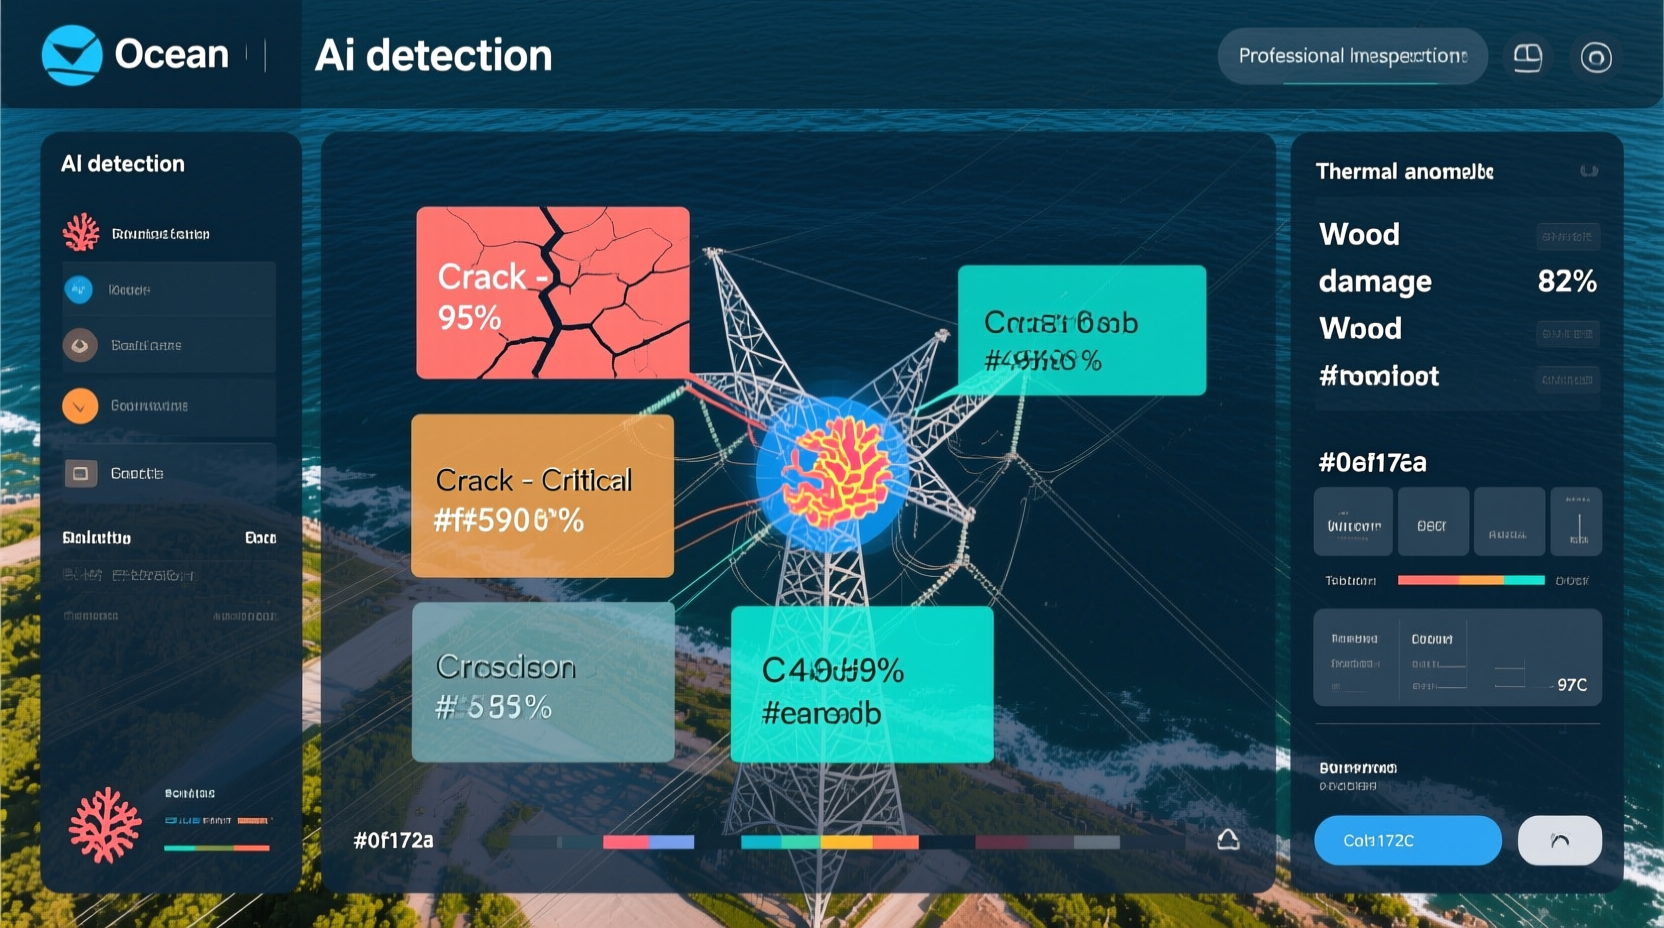
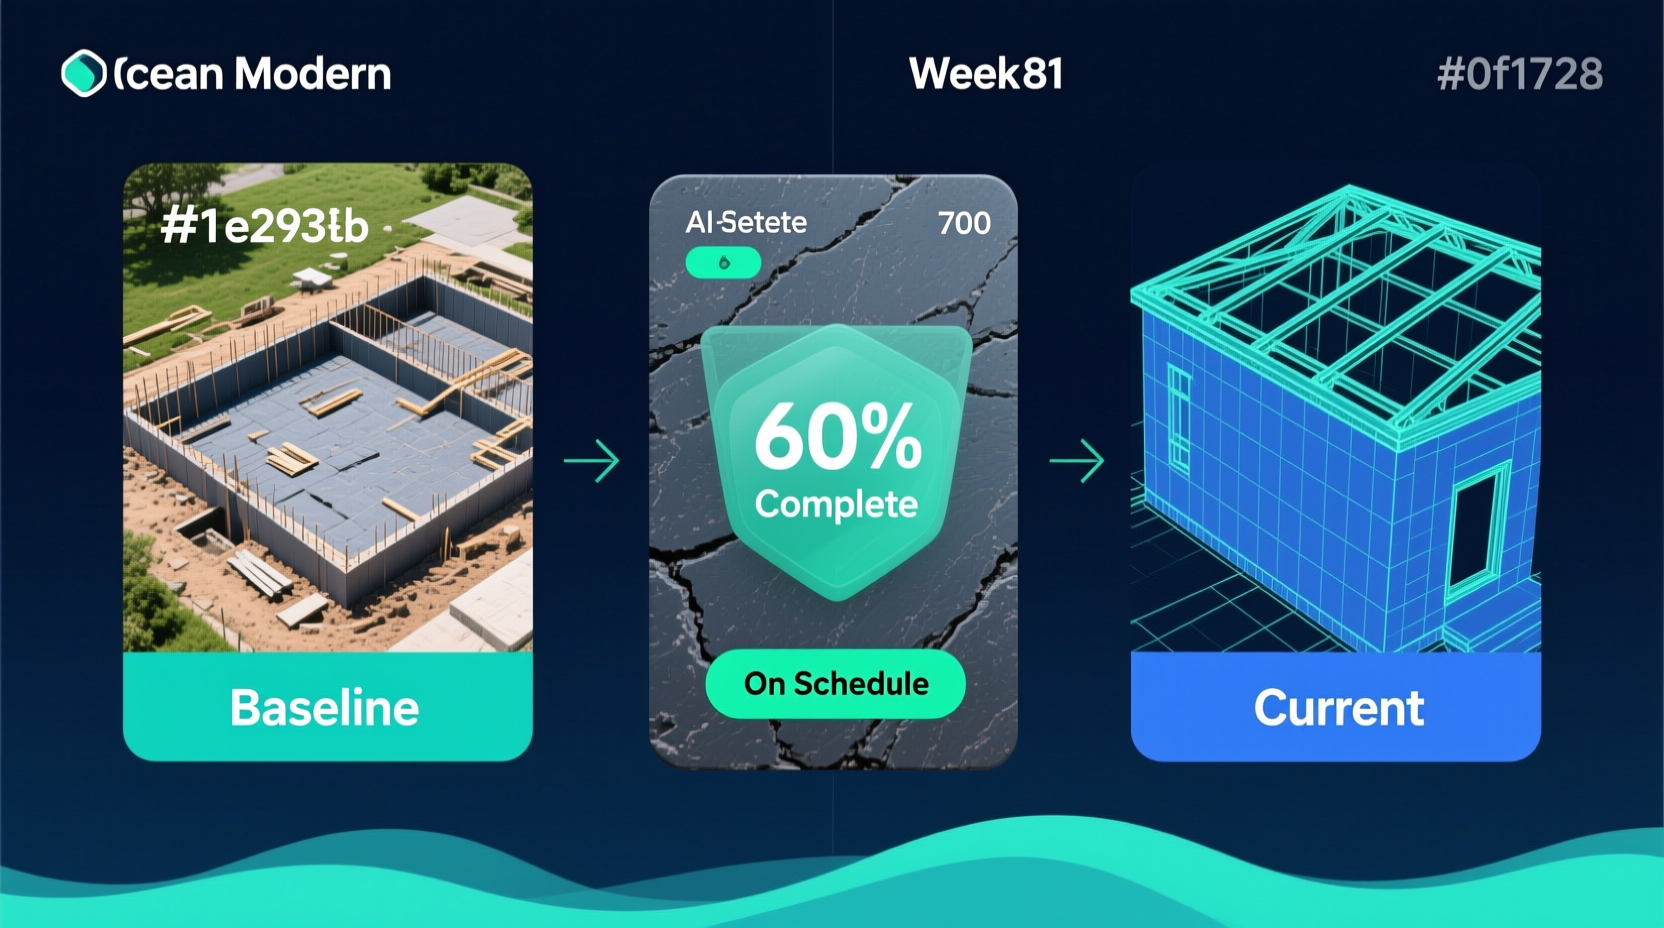
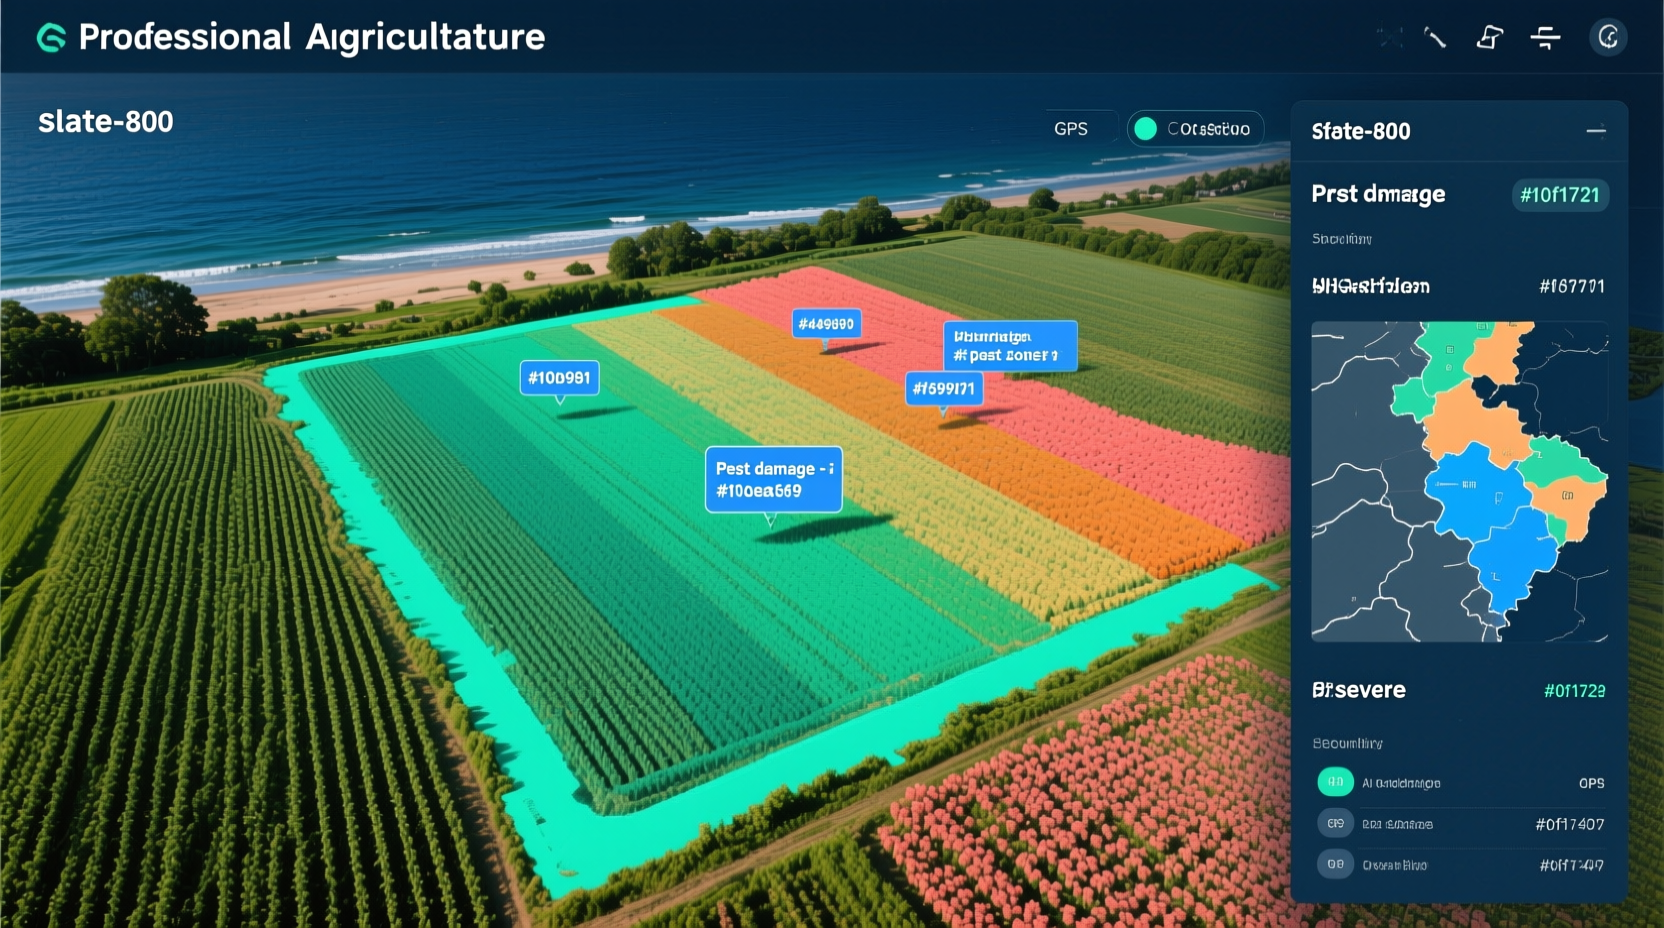
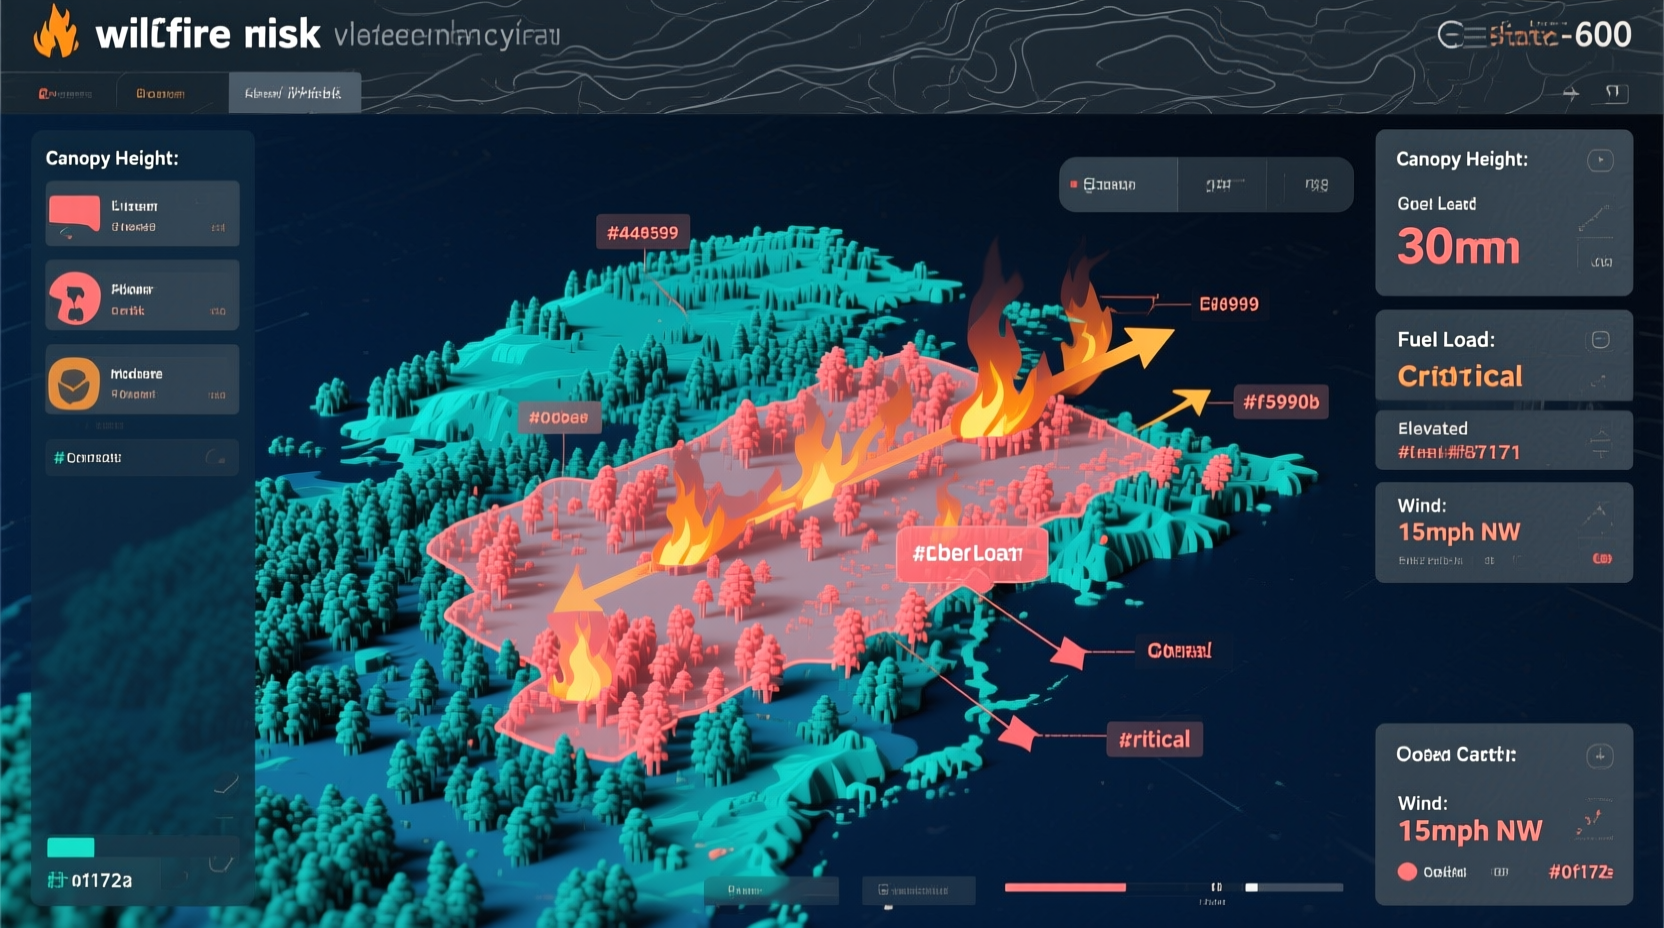
Here's the breakthrough: infrastructure inspection, construction progress tracking, agricultural monitoring, and wildfire assessment all need the exact same foundational capabilities. They all need to:

The only things that differ are: what specific objects we're detecting and which enterprise systems we integrate with.

Build time comparison: Sequential (116 weeks) vs Platform Strategy (58 weeks) - 50% faster

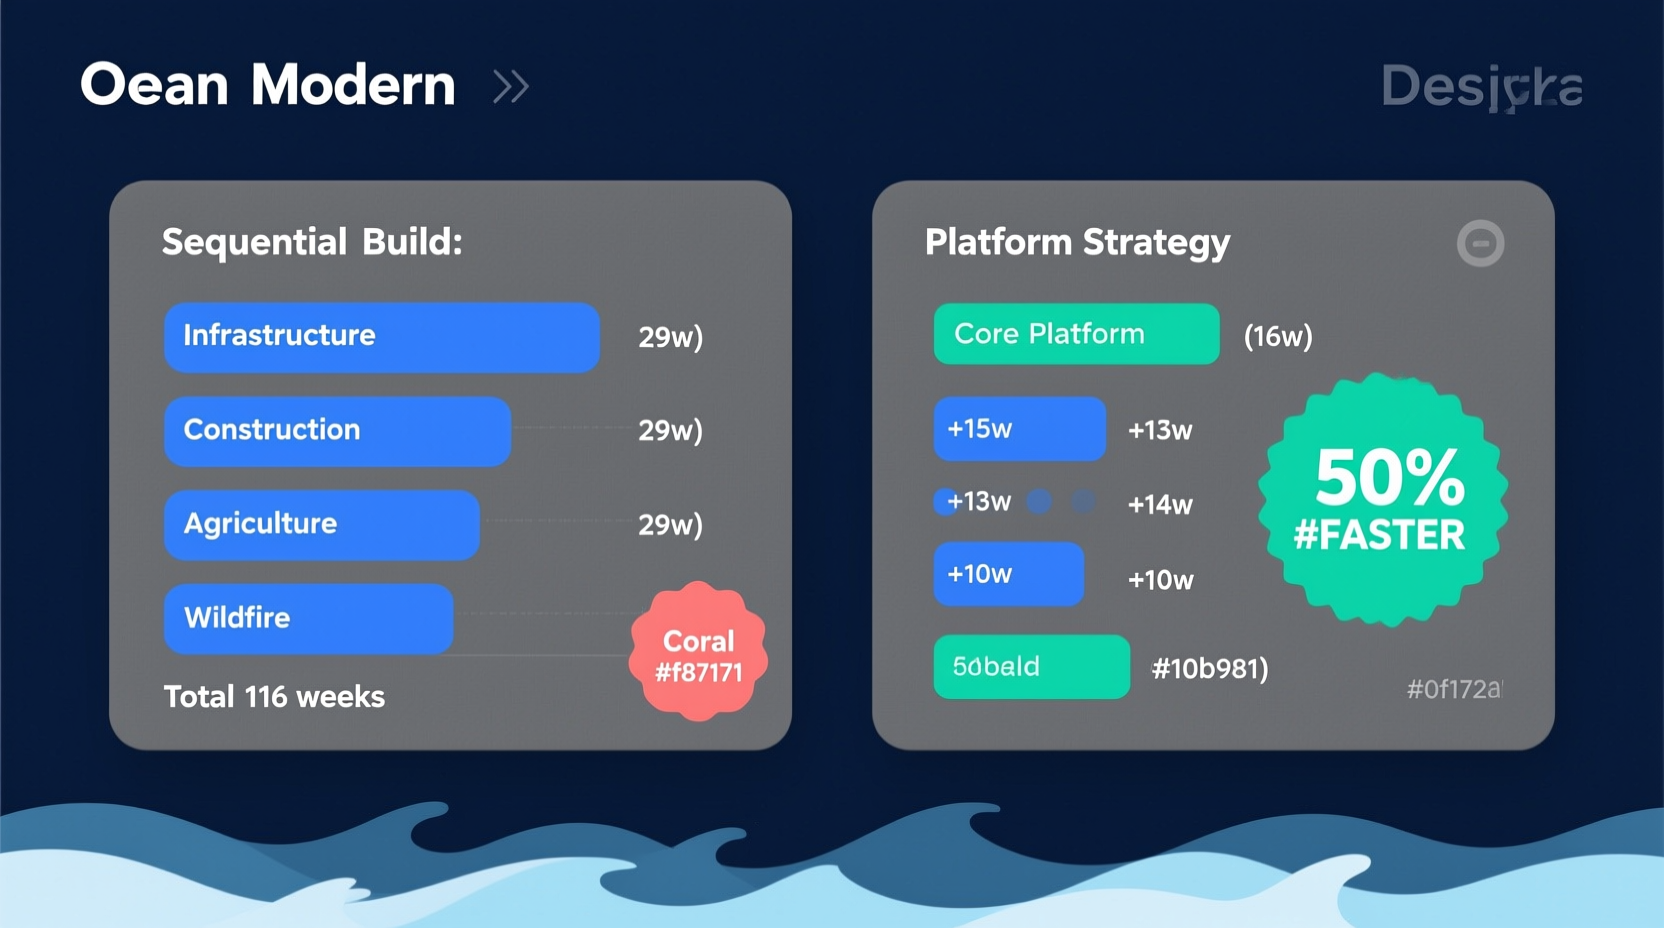
Platform Component Overlap Across Verticals
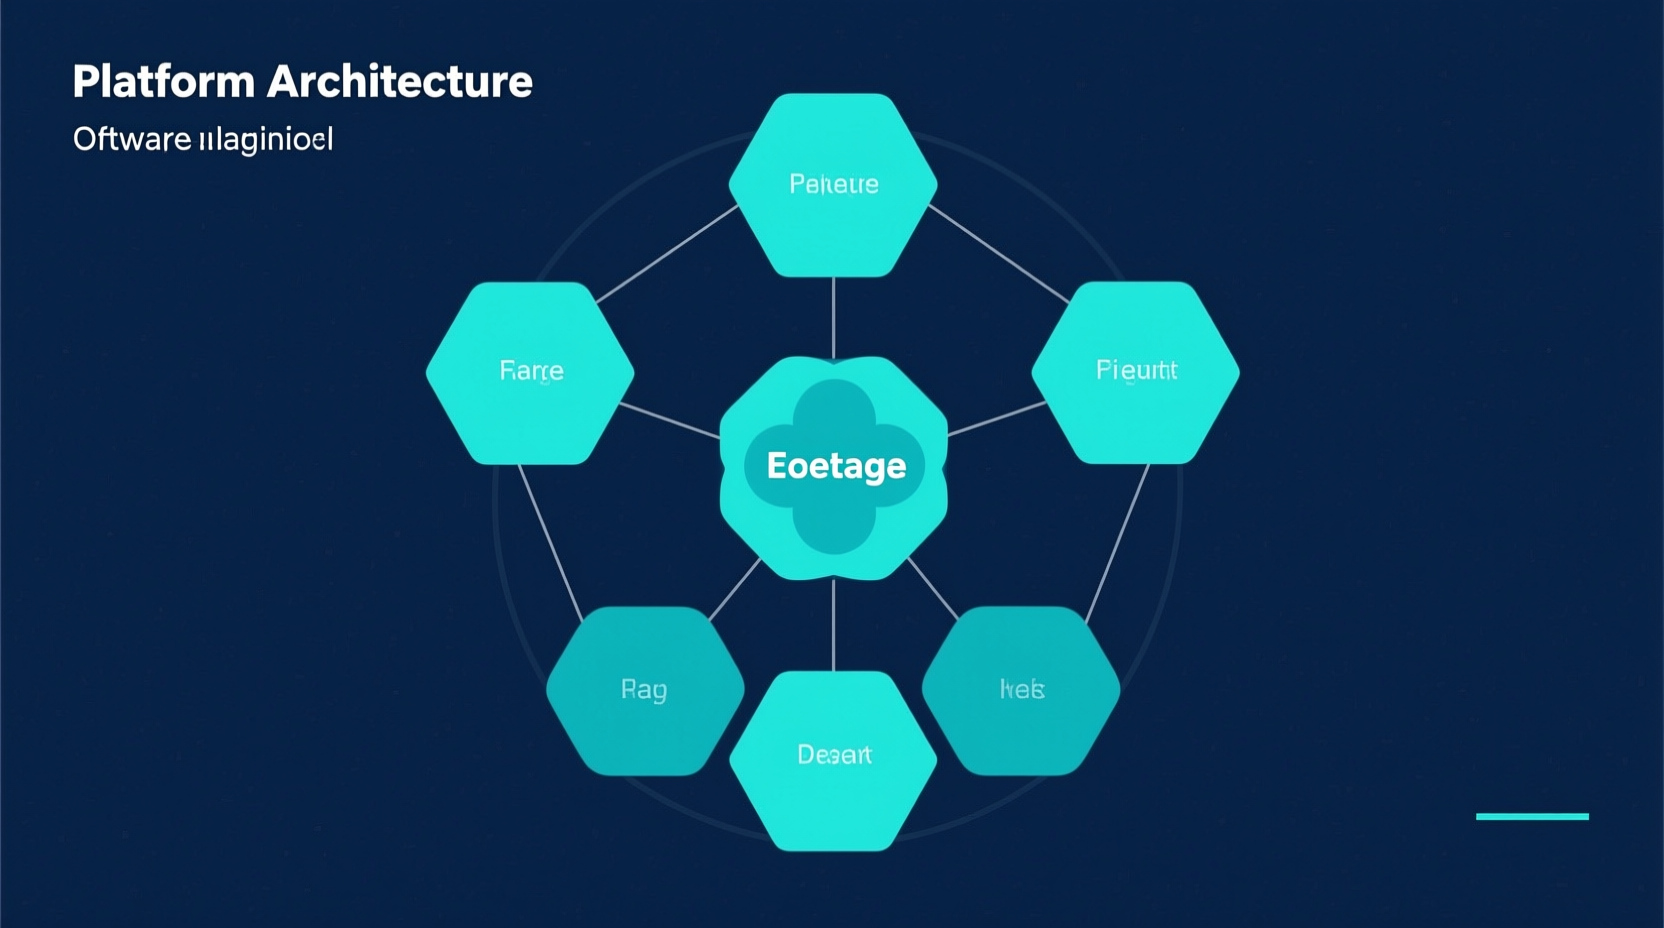
Platform overlap diagram showing how core components are reused across all verticals
100%

Image Processing

Bulk upload, quality scoringAutomated assessment of image sharpness, exposure, and coverage to flag unusable captures, EXIF extractionReading embedded camera metadata: GPS coordinates, altitude, timestamp, camera settings—identical for all verticals

95%

Georeferencing

OrthomosaicGeometrically corrected aerial image composite where all pixels are at the same scale stitching, UTMUniversal Transverse Mercator—a standard coordinate system for mapping coordinate systems—near-identical

80%

Change Detection

Temporal overlayAligning images from different dates to compare what changed, diff highlighting—same algorithms, different thresholds

100%

Reports & APIs

PDF templates, webhook systemHTTP callbacks that notify external systems when events occur (job complete, anomaly detected)—fully reusable

90%

Data Management

SAM integration, labeling pipelinesWorkflows for creating, reviewing, and exporting training data annotations—shared infrastructure

Platform Architecture: Core + Verticals

The platform separates shared infrastructure (80% of the work) from vertical-specific customizations (20%).

Core Platform Components (16 weeks total)

Image Processing Engine 6 weeks

100% shared across all verticals

Handles all UAV imagery from upload to analysis-ready state.

  • Bulk upload with deduplication
  • Quality scoring algorithms
  • RGB/thermal registration
  • Multi-format support (JPEG, TIFF, DNG, RAW)
  • EXIF metadata extraction

Annotation & Georeferencing 8 weeks

95% shared across all verticals

Maps pixels to real-world coordinates and enables precise annotations.

  • Orthomosaic stitching
  • UTM coordinate systems
  • Global georeferencing
  • Bounding box annotation UI
  • Segmentation mask tools

Change Detection 3 weeks

80% shared (thresholds vary by vertical)

Compares imagery over time to identify what's changed.

  • Temporal overlay alignment
  • Before/after visualization
  • Diff highlighting
  • Progress metrics & quantification
  • Threshold configuration per vertical

Reports & API Framework 4 weeks

100% shared across all verticals

Generates deliverables and connects to external systems.

  • PDF template system
  • Branded report export
  • Webhook notifications
  • REST API with Swagger docs
  • Async job status polling

Data & Labeling Management 5 weeks

90% shared across all verticals

Powers the ML training pipeline.

  • SAM 2/3 integration
  • Labeling task management
  • Annotation consensus workflows
  • Model versioning & registry
  • Training pipeline orchestration

Vertical-Specific Components (42 weeks across 4 verticals)

Infrastructure ML 15 weeks

Vertical-specific (20% of work)

Detects defects in utility poles, transmission lines, substations.

  • Defect detection ML model
  • Thermal anomaly detection
  • Asset classification
  • Maximo/SAP/ArcGIS integrations

Construction ML 13 weeks

Vertical-specific (20% of work)

Tracks progress, compares to plans, identifies safety issues.

  • BIM deviation detection
  • Safety violation identification
  • Material classification
  • Procore/BIM360 integrations

Agriculture ML 14 weeks

Vertical-specific (20% of work)

Monitors crop health, detects pests, optimizes inputs.

  • NDVI/multispectral analysis
  • Pest & disease detection
  • Weed identification
  • FarmLogs/Climate integrations

Wildfire ML 10 weeks

Vertical-specific (20% of work)

Maps fuel load, predicts fire spread, assesses damage.

  • LiDAR fuel load analysis
  • Fire spread modeling
  • Damage assessment
  • CAL FIRE integration

The Platform Pattern: ANY Vertical

The core platform handles 80%+ of every use case. The remaining 20% is just configuration—specific ML modelsMachine Learning models—neural networks trained to recognize patterns specific to each domain and enterprise integrationsConnections to business software like Maximo, Procore, or FarmLogs via APIs. Here are four example verticals that demonstrate the pattern:

🔑 The Key Insight

These four verticals are examples, not limitations. The platform pattern works for any aerial imagery analysis domain:

Each new vertical requires only: 1) Training data, 2) Domain ML model, 3) Integration connectors. The platform handles everything else.

Example Verticals (Illustrative)

Example Vertical

Infrastructure Inspection

Infrastructure defect detection with AI overlays

Utility poles, transmission lines, substations. Detect cracks, corrosion, vegetation encroachment.

Vertical-Specific (20%)
  • Thermal anomalyHot spots detected in infrared images that indicate equipment failure or overload detection
  • Maximo/SAP/ArcGIS integrations
  • NERCNorth American Electric Reliability Corporation—sets reliability standards for power grid compliance reporting
  • LiDAR clearance analysis
Example Vertical

Construction Progress

Construction progress tracking with change detection

Track building progress, detect deviations from BIM modelsBuilding Information Models—3D digital representations of physical buildings with embedded data, identify safety violations.

Vertical-Specific (20%)
  • BIM deviation detection
  • OSHAOccupational Safety and Health Administration—sets workplace safety standards safety compliance
  • Procore/BIM360 integration
  • Material classification
Example Vertical

Agricultural Monitoring

Agricultural crop health NDVI mapping

Crop health assessment, pest/disease detection, yield prediction, irrigation optimization.

Vertical-Specific (20%)
  • Multispectral/NDVINormalized Difference Vegetation Index—measures plant health using near-infrared and visible light analysis
  • Crop type classification
  • FarmLogs/Climate integrations
  • VRA prescriptionsVariable Rate Application—adjusting inputs like fertilizer based on field zones
Example Vertical

Wildfire Assessment

Wildfire fuel load visualization with LiDAR

Fuel load mapping, fire spread prediction, post-fire damage assessment, vegetation recovery.

Vertical-Specific (20%)
  • LiDAR CHMCanopy Height Model—3D map of vegetation height derived from LiDAR point clouds fuel load analysis
  • Fire spread modeling
  • CAL FIRE integration
  • Ember cast zoneAreas at risk from wind-blown embers during wildfires, typically mapped using terrain and wind modeling analysis

The SAMSegment Anything Model—Meta's foundation model that can segment any object in an image with minimal prompts Evolution: Our Labeling Superpower

Meta's Segment Anything Model evolves rapidly. Each version dramatically reduces labeling costsThe time and money spent manually annotating training data—often 80%+ of ML project costs.

SAM 1 (2023)

Click-to-segmentPoint at any object and the model generates a precise outline automatically on single images. Massive improvement over manual polygon drawingTraditional labeling method: clicking dozens of points to outline an object manually.

1 click → perfect mask (vs 30+ polygon points)

SAM 2 (2024)

Video-aware trackingObject persistence across frames—label once and the model follows the object through the video. Click once, track across frames automatically.

8.4x faster labeling for inspection videos

SAM 3 + VLMsVision-Language Models—AI that understands both images and natural language descriptions (2025)

Text-prompted detectionDescribe what you want in plain English and the model finds and labels it automatically. "Find all damaged insulators" → auto-labeled dataset.

10x reduction in labeling cost

SAM 3D (Coming)

LiDARLight Detection and Ranging—laser-based 3D scanning that measures distances to create point clouds + imagery fusionCombining data from multiple sensors (camera + LiDAR) for richer 3D understanding. 3D reconstruction with semantic segmentationLabeling every pixel with what it represents (tree, building, road, etc.).

Unlocks fuel load mapping, BIM deviation at scale

SAM 2: Manual vs Auto-Labeling

SAM 2 comparison: 8.4x faster labeling

SAM 3: Text-Prompted Detection

SAM 3 text-prompted detection interface

SAM 3D: LiDAR + Imagery Fusion

SAM 3D LiDAR and imagery fusion visualization

Weak Labels Pipeline

Data pipeline flowchart showing 10x faster labeling

58-Week Roadmap: Platform → 4 Verticals

Build the core platform once (16 weeks), then layer vertical-specific ML and integrations.

gantt title Dolphin AI: Complete Build Plan (58 Weeks) dateFormat YYYY-MM-DD section Core Platform Image Processing Engine :eng1, 2025-02-01, 6w Annotation Georeferencing :eng2, 2025-02-01, 8w Change Detection :eng3, 2025-03-15, 3w Report Generator :eng4, 2025-03-29, 4w API Framework :eng5, 2025-03-29, 4w section Infrastructure Defect Detection ML :eng7, 2025-05-17, 8w Thermal Anomaly :eng8, 2025-06-14, 3w Enterprise Integrations :eng10, 2025-07-26, 4w section Construction BIM Deviation ML :eng11, 2025-08-23, 6w Safety Violation Detection :eng12, 2025-09-20, 4w Procore Integration :eng14, 2025-11-01, 3w section Ag/Wildfire Vertical Specific ML :eng15, 2025-11-22, 7w Dashboard Integrations :eng16, 2026-01-10, 4w

Tech Stack Deep Dive

Click any technology to understand WHY we chose it and HOW it fits into the platform.

📋 Changelog

Jan 22 Added metadata — Document dates and changelog
Jan 22 Renamed — "Intelligence Layer Proposal: How We Can Build 80% of Every Project Now"
Jan 21 Platform cards — Added AI-generated pixel art for each component
Jan 20 Initial release — Intelligence layer strategy document
📅 Created: Jan 20, 2026 ✏️ Modified: Jan 22, 2026